
Operations Readiness Dashboard
Figures as of —Summary Manpower in —: — / — people against plan; OPS teams ORR checklist at — vs plan —; — PRs late.
Readiness status
On track At risk Off track Not assessedKey figures
Attention required
Items picked automatically from the data: late, overdue, expiring or below threshold.
Key milestones
Plan dates from the milestones table. Dates still to be confirmed show as TBC.
Manpower ramp-up: plan vs actual
Headcount by month. Dashed line is plan; the vertical marker is the report date.
OPS teams ORR checklist vs plan
Weighted % complete by month. Dashed line is plan, solid line is actual.
Current staffing
Filled / required positions at the report date.
Vacant positions: —.
Mandatory training – PQPOC offshore staff
Courses completed vs required by the HSE training matrix.
CBTA module development
Modules by status: completed, in review, in development.
CBTA by team: development and assessment
Module development and theory / OJT assessment progress for each team.
| Platform | Team | Modules | Completed | % developed | % theory assessed | % OJT |
|---|
CBTA module register
Every defined module with its document number, status and author.
| Team | No. | Module | Status |
|---|
Vendor training schedule
Courses by month. Past months are dimmed.
HSE training matrix
Which HSE courses each position needs (PQ-MS-HSE-GDL-001-U01). Choose a position to list its courses.
Progress by OPS team · —
Bar is actual %, black tick is plan %. The figure on the right is the gap in percentage points.
Weight and workload by team
Total and completed activities; weights roll up into the overall %.
| Team | Weight | Activities | Completed | Final plan |
|---|
Plan by team to June 2027
Cumulative plan % for each team by month, with the actual % below: green when on or ahead of plan, red when behind.
Checklist by element (People · Plant · Process)
Sorted from lowest %. Elements below 50% are shown in red.
| Code | Element | Items | Progress |
|---|
Sorted by % complete, lowest first, so open procedures sit at the top.
| No. | Document | Due | Completed |
|---|
Sorted by % complete, lowest first, so open procedures sit at the top.
| No. | Document | Due | Completed |
|---|
PRs in progress by stage
— PRs. Each block is one PR, coloured by schedule status.
Packages without PR
— packages in preparation, by status, priority and expected SCR timing.
Applications
Status of operations software systems.
CMMS (OA) – actual vs plan %
Logistics, services & coordination
Contracting route and next step.
Offshore platform permit register
Permits, reference number, issuing authority or responsible party, issue and expiry dates, and status.
| Permit | Issued | Expires | Status |
|---|
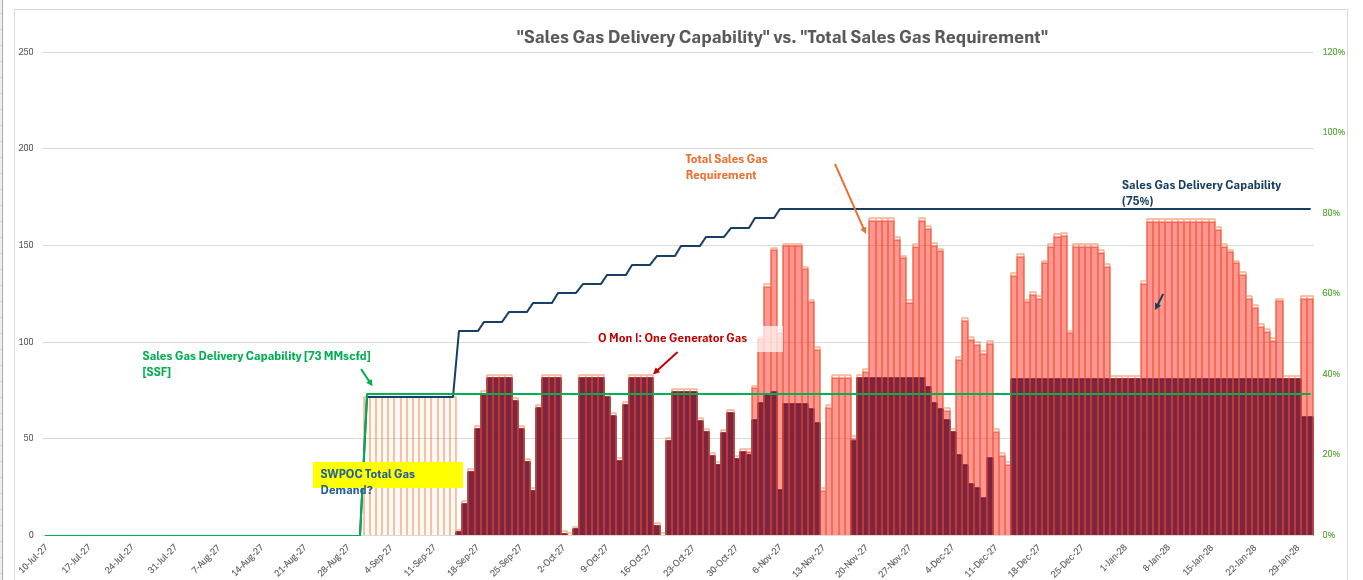
Production profile: sales gas capability vs requirement
—
CPP pre-commissioning master plan (Train 1)
Planned start – finish. Green: completed (has an actual finish date); red: inside its planned window on the report date; amber: starts within the next 30 days.
Preservation, installation & commissioning
CPP start-up sequence
Summarised from the CPP start-up block diagram.
Changes since the last saved day
Every figure compared with the copy saved at the end of an earlier day, item by item. Figures are cumulative, so a change is what moved since then.